Racial Disparities in the Proximity to Vehicle Air Pollution in the MAPC Region
May 2020
Authors: Conor Gately and Tim Reardon
Acknowledgments: Thanks to Scott Peterson, Ed Bromage, Jieping Li, and David Knudsen at the Boston Region MPO, and Professors Lucy Hutyra and Ian Sue Wing at Boston University, who were all instrumental in the development of the original emissions inventory used in this analysis.
Introduction
In the context of the current COVID-19 pandemic, much attention has been given to the differential patient outcomes related to existing medical comorbidities. Studies have identified increased risk of death from COVID-19 for patients with cardio-pulmonary illnesses. Recent research has also implicated historical exposure to ambient air pollution as a contributory risk factor for COVID-19 fatalities. Prior to the COVID-19 crisis, it had already been demonstrated that exposure to a subset of vehicle air pollutants known as ultrafine particulates (UFP) is strongly correlated with increased risks of developing cardio-pulmonary and other inflammatory diseases1-3. These illnesses, in turn, increase the risk of death for patients infected with SARS-Cov-2, the virus that causes COVID-19.
In the MAPC region, as elsewhere, road vehicles are a major source of local UFP emissions, and residents living near roadways with high levels of these emissions are exposed to significantly increased levels of UFP pollution. We performed an analysis to quantify the proximity of different populations to major sources of vehicle air pollution across the region. This report identifies key areas in the region where residents live close to large sources of vehicle pollution and quantifies the racial inequities that exist in pollution proximity. While this study does not directly quantify individual exposures of MAPC residents to air pollution, it provides a literal roadmap for identifying the populations most at risk and a benchmark against which future reductions in vehicle pollution can be measured.
UFP pollution is highly localized in nature, with concentrations of pollutants decreasing significantly at distances greater than a few hundred meters from the roadway edge4. This provides the potential for targeted interventions to reduce exposures in specific neighborhoods and the possibility of reducing inequities in exposure in the short term. These localized efforts should be pursued in tandem with broader state and regional efforts at greening the transportation sector, reducing greenhouse gas emissions, and improving air quality for all residents of the region.
Pollution Proximity Index
In this study, we analyzed the spatial patterns of residents living in close proximity to roads with the highest levels of vehicle air pollution emissions across the MAPC region. We focus on households living within 150 meters of high-emission roads and explore how the demographics of these populations changes as the pollution intensity of the roadways increases. To do this, we developed the Pollution Proximity Index (PPI), a weighted score that accounts for five factors: the volume, speed, and fleet mix of traffic on a given roadway; distance of residents to that roadway; and proximity to other high-emitting roadways nearby. High PPI values are found in areas with multiple high-traffic roadways — in particular, freeways — and urban arterial roads that carry a large volume of diesel-powered freight vehicles.
Figure 1. Interactive map of Pollution Proximity Index (PPI) for MAPC region
How Did We Calculate PPI?
The PPI is normalized onto a quintile scale of 1 – 5, with 5 representing the areas in the region with the highest 20% of emissions intensity values. Emissions intensity is quantified using annual roadway-scale emissions of nitrogen oxides (NOx) as a proxy for ultrafine particle emissions, as NOx and UFP are strongly correlated at near roadway distances5,6. NOx emissions were calculated using detailed vehicle travel data, including traffic volumes, fleet characteristics, and hourly vehicle speeds for all estimated “high-emitting” roadways (>500 vehicles per day). Full details of the emissions calculation can be found in this report’s technical memo. Emissions were weighted by the distance from the roadway edge, with the first 50 meters from the roadway weighted double to the 50 – 150-meter distance. This weighting was derived from measurement studies showing that the UFP concentrations decrease by 50% over the first 50 meters from a roadway edge, and then decline to near-background concentrations beyond 150 meters7,8. Those with a PPI value of zero are beyond 150 meters from a high-emitting roadway.
Population and demographic data was obtained from MAPC’s 250-meter gridded demographic data product, which assigns 2010 Census Block population and household data to a uniform 250 x 250 meter grid using geocoded residential address data, in combination with information on open space and undeveloped land. By overlaying this population data with spatial buffers of the roadway emissions, we calculated the cumulative overlap between the emissions buffers and each grid cell. This allowed us to account for populations located close to multiple high-emitting roads, as opposed to populations living close to only a single roadway edge. Full details of the PPI methodology and 250-meter demographic gridded data are described in this report’s technical memo.
Findings
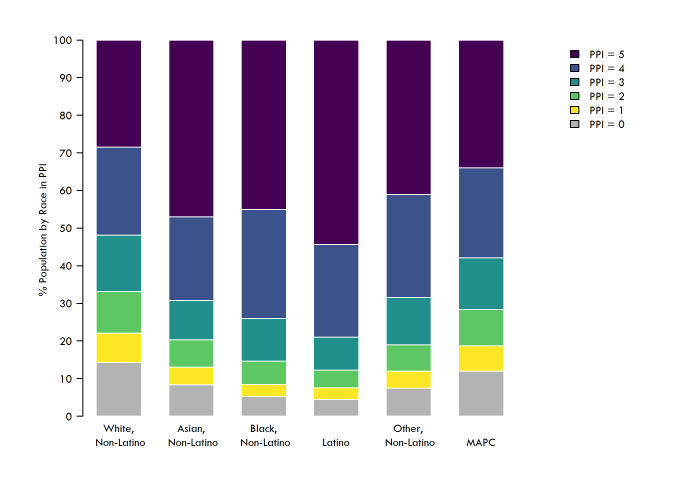
In the MAPC region, the vast majority of residents (88%) lived within 150 meters of a major roadway in 2010. However, the intensity of emissions on these roadways varies greatly based on traffic volumes, the percentage of heavy trucks, and congestion. One-third of MAPC residents (34%) lived in areas with the highest PPI rank of 5. The demographics of residents in these highest-scoring areas reveals significant inequities in the spatial patterns of residents by race. Figure 2 shows that residents of color are more likely to live in areas with higher pollution intensities. Over 45% of Black and Asian residents and over 50% of Latino residents live in the areas that score in the top 20% pollution intensity, compared to less than 30% of white residents.

Figure 2. Percent of MAPC residents by race and ethnicity in each PPI group
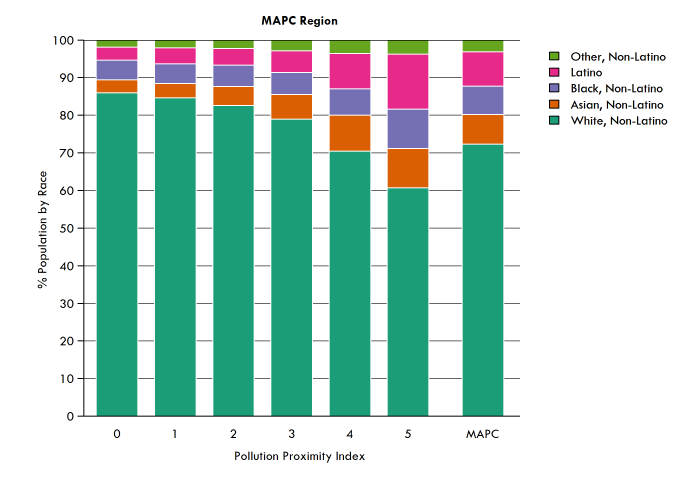
When we look at how the relative populations of residents by race changes as we move from the low PPI to the high PPI areas, we see a clear trend: the share of residents of color increases with increasing PPI. In the top PPI group, the percent of Black and Asian residents is 30-40% higher than their share of regional population, and the percent of Latino residents is 60% higher.

Figure 3. Distribution of population by race and ethnicity in each of the PPI categories, and for the MAPC region as a whole. The relative share of populations of color increases significantly as the pollution proximity increases.
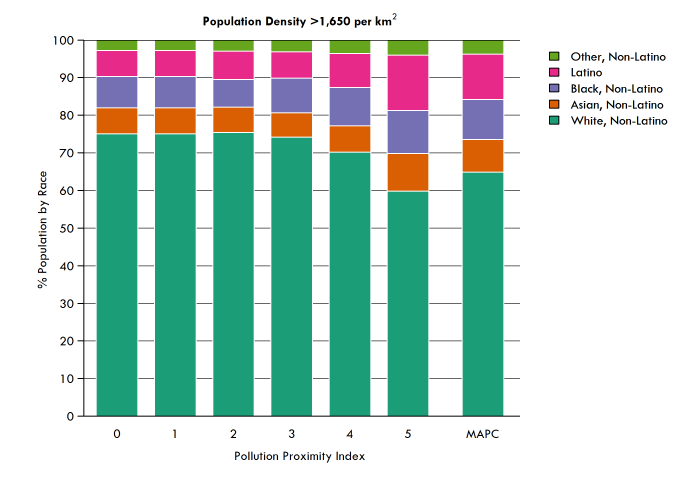
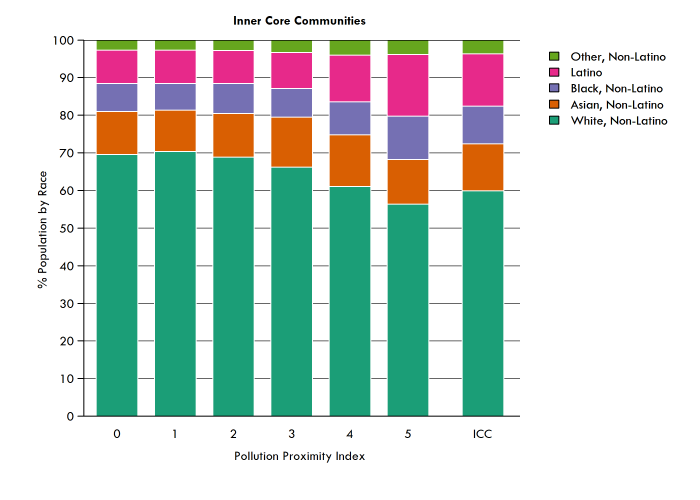
These trends are visible at the regional level and in more specific areas, such as areas with higher population density (Figure 4) and subregions like the Inner Core Committee (Figure 5).

Figure 4. Distribution of population by race and ethnicity and PPI in the 20% of grid cells with the highest population density.
For grid cells with population densities greater than 1,650 persons per square kilometer (~4,275 persons per square mile), we observe the same trend as we see region-wide, although the share of residents of color in each of the PPI groups increases relative to the broader region. This demonstrates that the disparities in pollution proximity are not simply because there are more people of color living in denser, urbanized areas. Even within these denser areas, there are locations with lower or higher levels of pollution intensity, and we observe that residents of color are disproportionately living nearer to the higher levels of pollution.
For the Inner Core Committee communities, the patterns are similar. Even with the correlated increases in populations of color in the denser communities of the region, we still see that residents of color are disproportionately living in areas with the highest levels of vehicle air pollution.

Figure 5. Distribution of population by race and ethnicity and PPI in Inner Core Committee communities.
Our findings are consistent with other studies that have also demonstrated the existence of persistent racial inequities in exposure to ambient air pollution across Massachusetts. The overlapping spatial patterns of pollution and residents of color is not merely a quirk of geography. There are a range of reasons for why the residences of people of color are disproportionately co-located with high-polluting roadways. These patterns reflect the historical impacts of inequitable zoning and redlining, choices of locations for affordable housing development, and the siting of urban freeways and expressways, which were often designed to cut through minority neighborhoods. What the findings of this research brief reveal is that the impacts of these historical inequities continue to impose a disproportionate burden on the health and well-being of people of color, not just in the urban core but across the region. As such it is critical that policies and remedies to reduce air pollution focus on addressing these ongoing disparities in environmental justice in our region.
Taking Action
There are a range of mitigation techniques and interventions that have been suggested or studied to reduce the impacts of traffic-related air pollutants such as UFP in urban areas. Actions can be taken at both small-scale and systemic levels to protect our residents exposed to air pollution by:
- Modifying individual buildings to keep polluted air out by moving air intakes for ventilation systems to places protected from road emissions and tightening the building envelope through additional insulation, soundproofing retrofits, and air filtration systems.
- Ensuring new buildings built near high pollution roads have filters with a Minimum Efficiency Reporting Value (MERV) of 13 or greater and have plans for long-term maintenance.
- Expanding access to affordable housing in areas that are at a safer distance from existing high pollution roads.
- Empowering communities of color to have influence on the construction or expansion of new roads in their neighborhoods.
- Improving urban design by installing highway sound barriers, orienting buildings to improve airflow and allow pollution to disperse quickly, and siting parks, playgrounds, schools and new residential development away from high-emissions roads.
- Implementing traffic management solutions like reducing local truck traffic and improving traffic flow at intersections.
- Taking steps toward broad, systemic change to reduce emissions’ root cause: a fossil-fuel powered, largely single-occupant vehicle fleet. We can reduce our greenhouse gas emissions by encouraging people to take alternate, cleaner means of transportation; improving our public transit, pedestrian, and bicycle infrastructure; shifting to electrification; and participating in regional policy initiatives like the Transportation Climate Initiative, a 12-state collaboration aimed at reducing transportation-related emissions.
As the Commonwealth begins to recover from the pandemic, it is important we recognize the inequities that this crisis has made deeply evident. Addressing disparate impacts should be at the forefront of an equitable economic recovery. Targeted investments in clean transportation solutions is not only an effective job creation mechanism but can also help confront some of the unequal public health outcomes this analysis has highlighted.
Questions? Reach out to Conor Gately at [email protected].
A shapefile of the 250-meter gridded population data with associated PPI scores is available for download at the MAPC DataCommon: https://datacommon.mapc.org/browser/datasets/413
REFERENCES
1 https://doi.org/10.1161/CIR.0b013e3181dbece1
2 https://doi.org/10.1186/s12940-018-0379-9
3 https://doi.org/10.1289/ehp.1307081
4 https://doi.org/10.1016/j.atmosenv.2012.04.004
5 https://doi.org/10.1289/ehp.1306518
6 https://doi.org/10.1016/j.atmosenv.2007.09.042
7 https://doi.org/10.1080/10473289.2002.10470842
